
If you’re reading this, you probably know a thing or two about data. Data is one of the most rapidly growing resources in our world, with an estimated 402 million terabytes created every day. Data is everywhere. And yet, most organizations are not meaningfully data mature. They’ve deployed dashboards, hired analysts, and run reporting cycles, but data still doesn’t reliably inform how they hire, where they expand, or which product bets they make.
At SafeGraph, this gap is something we observe closely. As a company that provides location data and point-of-interest records to developers, researchers, and analysts worldwide, we work across the full spectrum of organizational data maturity. We’ve seen what it looks like when data is truly embedded and what it looks like when it isn’t.
In 2021, we published a data maturity model based on our research. In 2026, we’ve expanded it significantly: every stage now includes diagnostic signals, real-world examples, and specific progression steps.
What Is Data Maturity?
Data maturity is a measurement of how deeply and consistently an organization uses data to shape decisions, strategy, and operations. It’s not about data volume. A company with petabytes of logs but no analytical culture is less data mature than a 50-person team with clean processes for sourcing, interpreting, and acting on third-party data.
Sisense tells us that “data maturity is a measurement of how advanced a company’s data analysis is.” Seems like a reasonable definition, but what does that really mean?
The most useful definition comes from asking: can this organization do something tomorrow with data that it couldn’t have done last year? If the answer is yes, if data is expanding capability, not just reporting on the past, the organization is advancing in maturity. If the answer is “we’re basically doing what we were doing three years ago,” that’s a diagnostic in itself.
For us, data maturity is a journey of exploration. It begins with treating data as a record of what happened and eventually arrives at treating data as a competitive instrument, something that shapes what will happen.
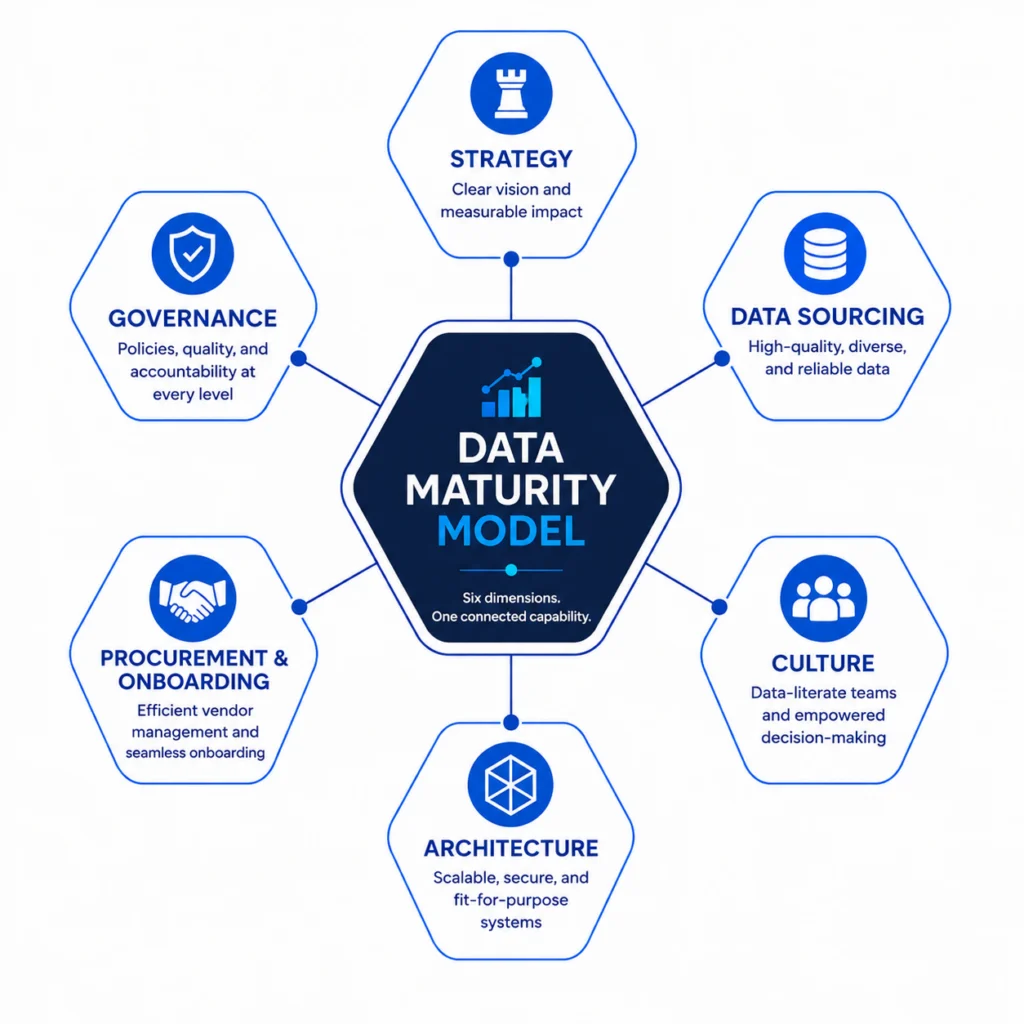
The SafeGraph Data Maturity Model: Six Dimensions
Our model evaluates maturity across six dimensions of the business. Together, they paint a complete picture of how data-capable an organization actually is:
| Dimension | 1 · EXPLORER | 2 · USER | 3 · LEADER | 4 · INNOVATOR |
| Strategy | No defined data strategy; reactive | Data informs some decisions | Data central to planning cycles | Data is a core business asset |
| Data Sourcing | Internal only; no external data | Selective external datasets added | Third-party data routinely enriches models | Proprietary + licensed data combined into unique assets |
| Culture | Data is an IT or analyst concern | Data used across org, still siloed | Cross-functional data literacy | Data-first decision making is default |
| Architecture | Spreadsheets, isolated tools | Centralized warehouse or BI tool | Scalable pipelines; real-time access | ML infrastructure; automated decisioning |
| Governance | No formal policies | Basic quality standards exist | Governance team; compliance built in | Governance embedded across org; ethics reviewed |
| Procurement & Onboarding | No process; ad-hoc | Case-by-case evaluation | Standardized vendor vetting | Dedicated procurement team; continuous pipeline |
The sixth dimension: procurement and onboarding is one we added ourselves. It rarely appears in other maturity frameworks, but in our experience it’s what separates organizations that can scale data operations from those that get stuck evaluating the same vendor for six months. The most data-mature companies have a repeatable system for sourcing, vetting, and operationalizing new datasets. That’s a capability, and it compounds.
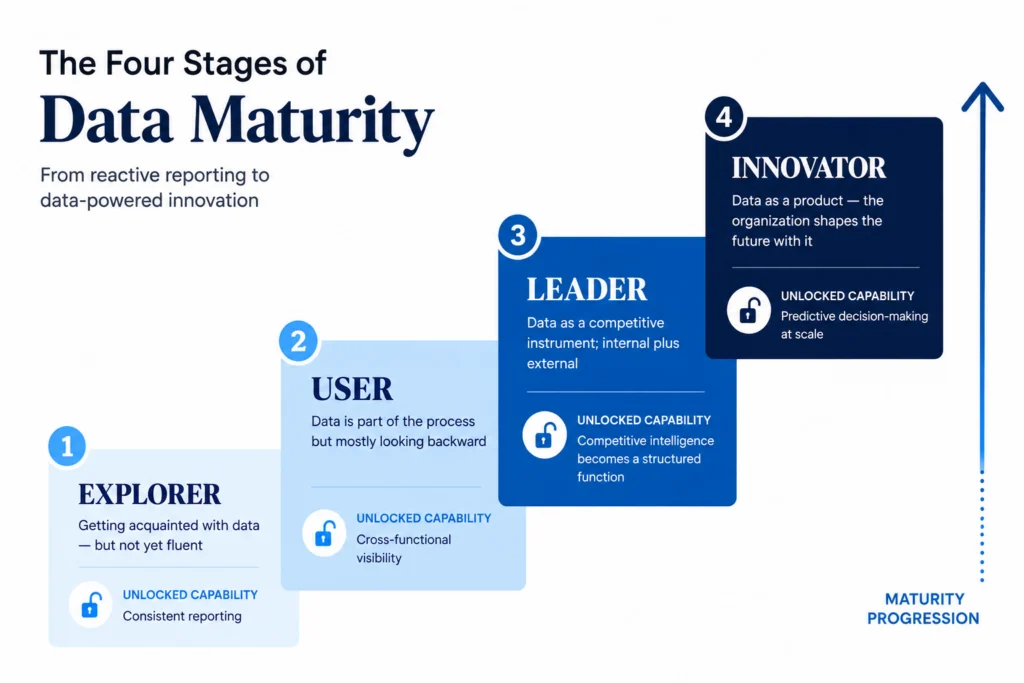
The 4 Stages of Data Maturity: A Detailed Breakdown
Many companies and industries have developed data maturity curves or models to illustrate how data can be integrated into business processes. Data maturity curves and models exist for very specific topics, such as customer data, as well as more universal themes like data governance. The SafeGraph data maturity model is designed to be generally applicable across all organizations, regardless of the specific type of data they use.
To create our data maturity model, we looked at six aspects of a business: strategy, data, culture, architecture, data governance, and procurement/onboarding. We used the different levels of sophistication across each of these aspects to then develop four unique stages in data maturity.
1. Explorer
Getting acquainted with data, but not yet fluent
Explorer organizations are beginning their relationship with data. Reporting exists, but it’s largely retrospective, describing what happened rather than why, or what might happen next. There’s no defined data strategy at the executive level, and most data-related work happens reactively: someone needs a number, someone builds a spreadsheet to find it.
Data governance is informal or nonexistent. There are no documented definitions for key metrics, which means different teams often work from different numbers. The concept of “data quality” hasn’t yet been formalized. External data sources, any third-party signals that could contextualize or enrich the internal picture, are not part of the workflow.
This doesn’t mean Explorers aren’t doing valuable work. Many are collecting the right data, running sound analyses, and making reasonable decisions. The limitation is structural: each data effort is largely isolated. There’s no flywheel.
Diagnostic Signals
- Reports are built on request, not proactively
- Multiple “versions of the truth” for the same metric
- Data work sits with one team or one person
- No documented data definitions or data dictionary
- External data has never been purchased or evaluated
To Advance to Stage 2
- Establish a single source of truth for core metrics
- Document definitions for 10–15 key business KPIs
- Move from spreadsheets to a centralized BI tool
- Identify one decision that would improve with external data
- Assign data ownership even informally per domain
Real-world scenario A regional restaurant group tracks revenue and covers per location in Excel. Each GM maintains their own sheet. Quarter-end reporting requires a weekend of reconciliation because each file uses slightly different column structures and date formats. The team knows they need better tooling but hasn’t yet defined what “better” means or who owns that decision. |
2. User
Data is part of the process, but mostly looking backward
User-stage organizations have made the first meaningful commitment: data quality matters, and we’ll invest in it. There’s typically a centralized BI tool, a defined set of dashboards, and cross-functional visibility into core metrics. Data isn’t just a finance or IT concern anymore, it’s part of how product, marketing, and operations run their weekly reviews.
The key characteristic of Stage 2 is that data use is reactive and internal. External data might make an occasional appearance; a market research report, a survey dataset, but it’s not routinely integrated. The organization’s view of itself is good. Its view of its competitive context remains thin.
Stage 2 organizations often plateau here longer than expected. They’ve achieved enough capability to feel data-driven, but they’re missing the external signals and forward-looking analytics that would actually make them competitive. The difference between Stage 2 and Stage 3 is often not technical; it’s a strategy decision about whether external data belongs in the core workflow.
Diagnostic signals
- Strong internal metrics; weak external context
- Dashboards exist but don’t inform strategic bets
- Data literacy concentrated in analytics team
- External data used sporadically, not systematically
- Forecasting done manually or with simple models
To advance to Stage 3
- Identify competitive intelligence gaps in your current reporting
- Pilot one third-party dataset enrichment (e.g., location, firmographic)
- Build a data literacy program across non-technical teams
- Create a formal process for evaluating external data vendors
- Assign a data owner at the executive or VP level
Real-world scenario A regional retail chain has a robust Tableau environment. Store managers get daily sales and inventory dashboards. The marketing team runs A/B tests on email campaigns with statistical rigor. But when the VP of Real Estate asks “where should we open our next three locations?” The answer comes from gut instinct and broker relationships, not data. The external signals that would answer that question (location demographics, competitor density, foot traffic patterns) simply aren’t in the stack. |
3. Leader
Data as a competitive instrument; internal plus external
Leader organizations have made the critical transition: they now combine internal data with external signals to build a picture their competitors cannot easily replicate. They’re purchasing or licensing third-party datasets, demographic data, geospatial data, firmographic data, market research and they have the infrastructure and analytical capability to integrate it.
This stage is defined by proactive data use. Rather than asking “what happened last month?”, leaders are asking “what’s happening in our market right now, and where is the opportunity?” Competitive intelligence is a structured function, not a side project. Data governance exists as a formal discipline with ownership, policies, and compliance processes.
Data procurement, the process of finding, evaluating, and onboarding external datasets is a repeatable capability at Stage 3. It’s no longer a one-off project that takes six months. Leaders have vendor evaluation criteria, data quality standards, and onboarding workflows that let them operationalize new datasets in weeks rather than quarters.
Diagnostic signals
- Third-party data is part of routine analytical workflows
- Competitive intelligence is regularly reviewed at exec level
- Data governance team exists with clear ownership
- Analytics inform major strategic decisions (expansion, pricing)
- Procurement process for new data is documented and repeatable
To advance to Stage 4
- Move from descriptive to predictive modeling in core use cases
- Build proprietary data assets from your own operational exhaust
- Invest in real-time data infrastructure
- Embed data scientists in product and strategy teams
- Define data as a product; with roadmaps, owners, and SLAs
Real-world scenario A commercial real estate firm licenses point-of-interest data from SafeGraph Places to build site-selection models. Every candidate location is scored against a model that incorporates nearby POI density, category mix, and geographic attributes from SafeGraph’s Geometry dataset. The firm has a data procurement lead who evaluates new data providers quarterly. Their site-selection hit rate has improved measurably against their historical baseline and their competitors are still using broker reports. |
4. Innovator
Data as a product, the organization shapes the future with it
Innovator organizations have fundamentally redefined data’s role. It’s not a support function. It’s not even a competitive advantage. It’s the product itself, or it’s the engine that creates products no one else can build. Predictive models, automated decisioning, and proprietary data assets are central to the business model, not peripheral to it.
What distinguishes Innovators is not just sophistication, it’s irreversibility. The data infrastructure, model depth, and governance maturity they’ve built are genuinely difficult for competitors to replicate. A new entrant can’t reproduce in two years what took an Innovator a decade of data accumulation and model training to create.
Governance at this stage isn’t just compliance, it’s ethics. Innovators are thinking about the downstream effects of algorithmic decisions, bias in training data, and what responsible data use looks like at scale. They’re also doing something unusual: treating their own operational data as a monetizable asset, whether through licensing, research partnerships, or published insights.
Diagnostic signals
- Proprietary models power core product decisions in real time
- Data is treated as an asset with a defined roadmap
- Organization has unique data no competitor can easily access
- Governance includes ethics review for algorithmic outputs
- External parties seek access to your data or models
To stay at Stage 4
- Continuously expand proprietary data collection
- Invest in AI/ML infrastructure and talent retention
- Publish research, thought leadership compounds authority
- Build data feedback loops into every product touchpoint
- Review governance frameworks annually as models evolve
Real-world scenario A financial services firm uses a combination of licensed location intelligence, proprietary transaction data, and public records to generate credit risk scores for underserved markets where traditional bureau data is thin. The model runs in near-real time, is continuously retrained on new outcomes data, and has expanded the firm’s addressable market by 40%. The data infrastructure behind it took four years to build and cannot be replicated from commercially available tools alone. |
The Maturity Progression: What the Journey Actually Looks Like
- Establish definitions before building infrastructure. Most Stage 1 organizations rush to buy tools. The more durable investment is defining what your data means; documented metric definitions, data ownership, and a shared vocabulary. Tools built on ambiguous definitions produce ambiguous results.
- Identify one strategic question that external data could answer. For Stage 2 organizations, the path forward starts with a specific question, not a general “we should be more data-driven” mandate. Where should we expand? Who are our most valuable prospects? What does the competitive landscape look like in this region? Find the question, then find the data.
- Build procurement as a capability, not a project. The transition from Stage 2 to Stage 3 fails when external data integration is treated as a one-time initiative. Build a repeatable process for sourcing, evaluating, and onboarding datasets. Assign ownership. Set standards for data quality and compliance review.
- Move from describing the past to shaping the future. Stage 3 to Stage 4 requires a shift in orientation from analytics that explain to models that predict and inform action in advance. This usually requires dedicated data science investment and a willingness to give models real decision-making authority.
Four Ways to Benchmark Your Organization’s Data Maturity
Knowing the stages is useful. Knowing where your organization actually sits is more useful. Think of the four tools below as a sequence rather than four competing options: start with the SafeGraph survey for a full organizational read across all six dimensions, then use the TDWI assessments to drill into the two dimensions where most organizations have the largest gap; governance and data quality. If your team wants an external analyst benchmark to bring to leadership, Gartner’s IT Score for Data and Analytics provides that frame of reference.
Assessment 01 SafeGraph Data Maturity Survey Our proprietary survey covers all six dimensions of the model; strategy, culture, architecture, governance, data sourcing, and procurement. Results are anonymous and contribute to industry benchmarks across verticals. Take this first for the broadest picture. |
Assessment 02 TDWI Data Governance Maturity Assessment TDWI’s governance assessment helps organizations understand the maturity of their data governance program and identify priority next steps. Particularly useful for Stage 2 to Stage 3 transitions, where governance gaps become blockers. |
Assessment 03 TDWI Data Quality Maturity Assessment
|
Assessment 04 Gartner IT Score for Data and Analytics
|
Data Maturity Is Not a Destination
The Innovator stage isn’t a finish line. The definition of what it means to be data-mature is moving, driven by new techniques (generative AI applied to data synthesis, real-time spatial analytics, large-scale foundation models for business data), new data types, and a competitive environment where yesterday’s Innovator becomes tomorrow’s Leader.
What’s stable is the direction: organizations that consistently invest in data quality, data procurement, and analytical culture outperform those that don’t. The compounding effect is real. A company that builds Stage 3 capabilities this year is harder to compete with in three years, not because they’ll have more data, but because they’ll have three more years of model training, workflow refinement, and institutional knowledge about how to act on data fast.
If your organization is at Stage 1 or 2 today, the right question isn’t “how do we become an Innovator?” It’s “what’s the single most valuable thing external data could tell us right now?” That question, answered and acted on, is the beginning of the journey.